DebugKit Runtime
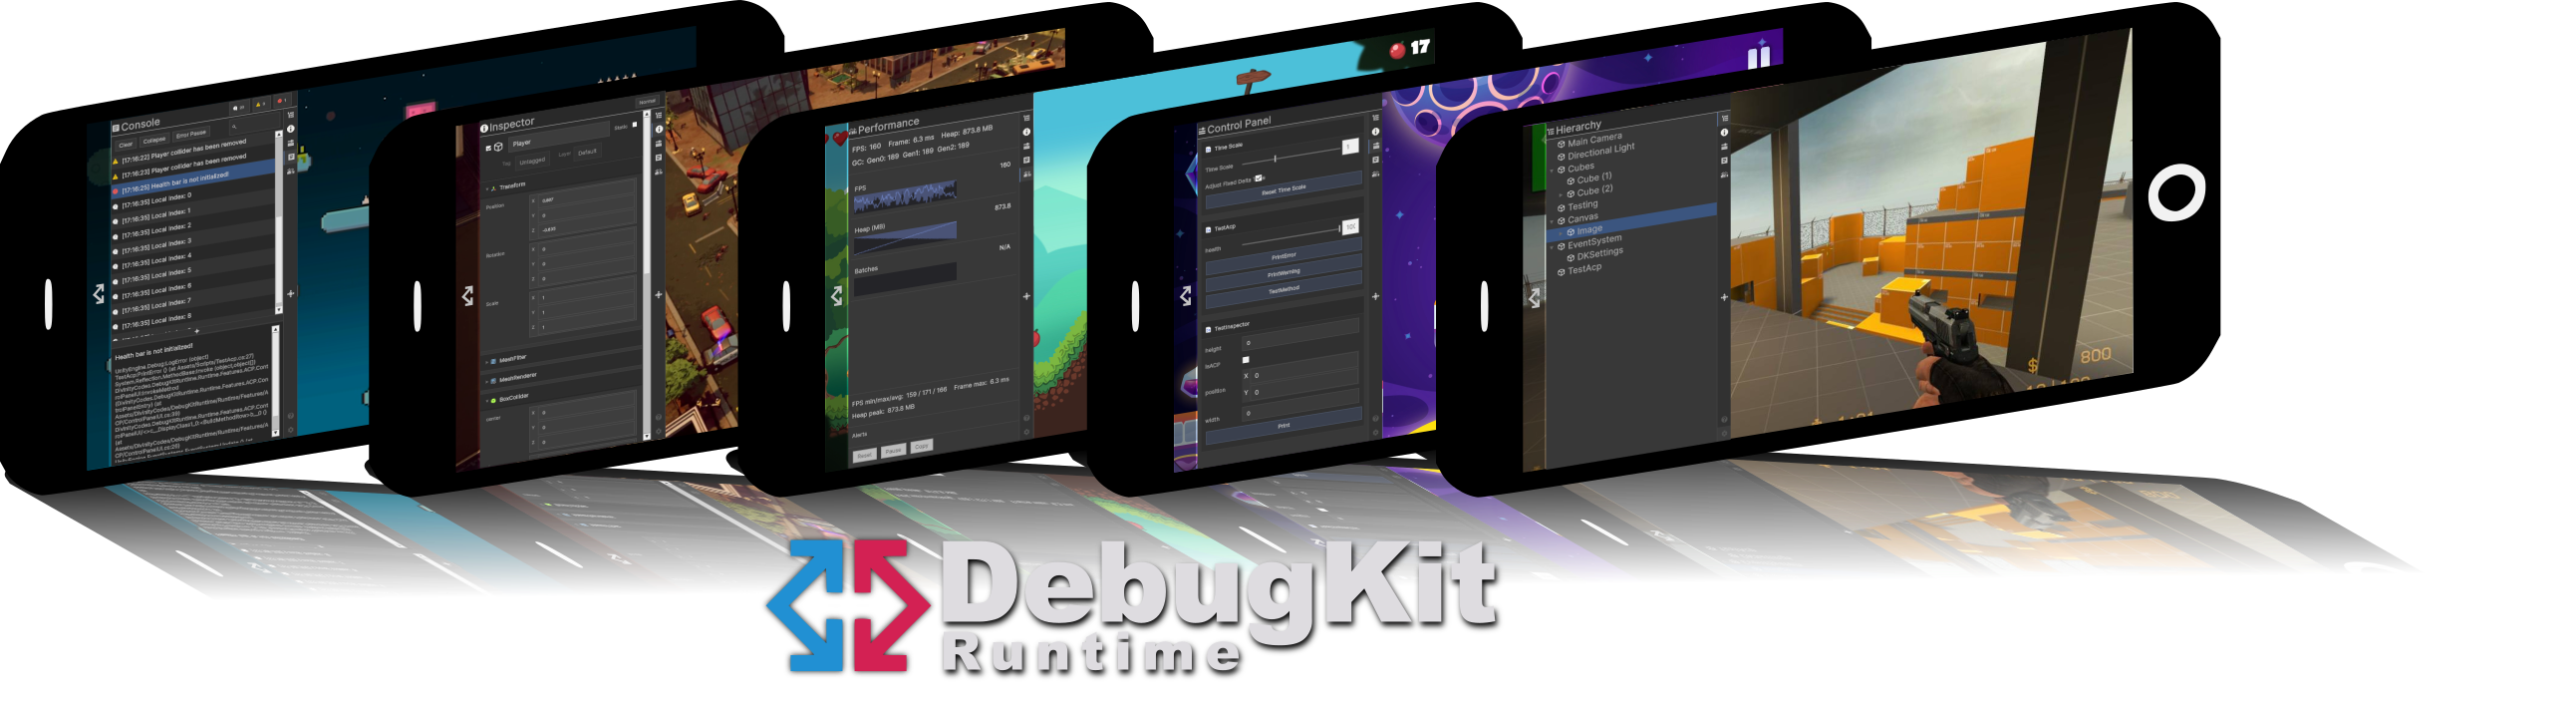
DebugKit Runtime is a powerful, production-ready debugging suite that runs inside your built application (Standalone, Mobile, or Consoles). It provides a familiar, Editor-like experience directly on your test device, allowing you to solve problems without tethering to a PC.
Overview
The tool appears as a resizable, collapsible side panel built entirely with Unity UI Toolkit. It is designed specifically for touch-screens and high-resolution mobile displays, ensuring your debug data is always readable and interactive.
Key Capabilities
-
Runtime Hierarchy: Browse all active GameObjects, expand deep trees, and select objects for inspection.
-
Advanced Inspector: View and edit component fields in Normal or Debug modes. Supports nested classes, collections, and dictionaries via Reflection.
-
Live Console: Capture, search, and filter logs. Includes full stack traces and collapse functionality.
-
Performance Monitoring: Track FPS, Frame Time, and Memory (Heap/GC) with high-frequency sparkline graphs.
-
Admin Control Panel: Create custom dashboards using
[ControlPanelMember]and[ControlPanelMethod]attributes to trigger logic instantly.
Adaptive Design
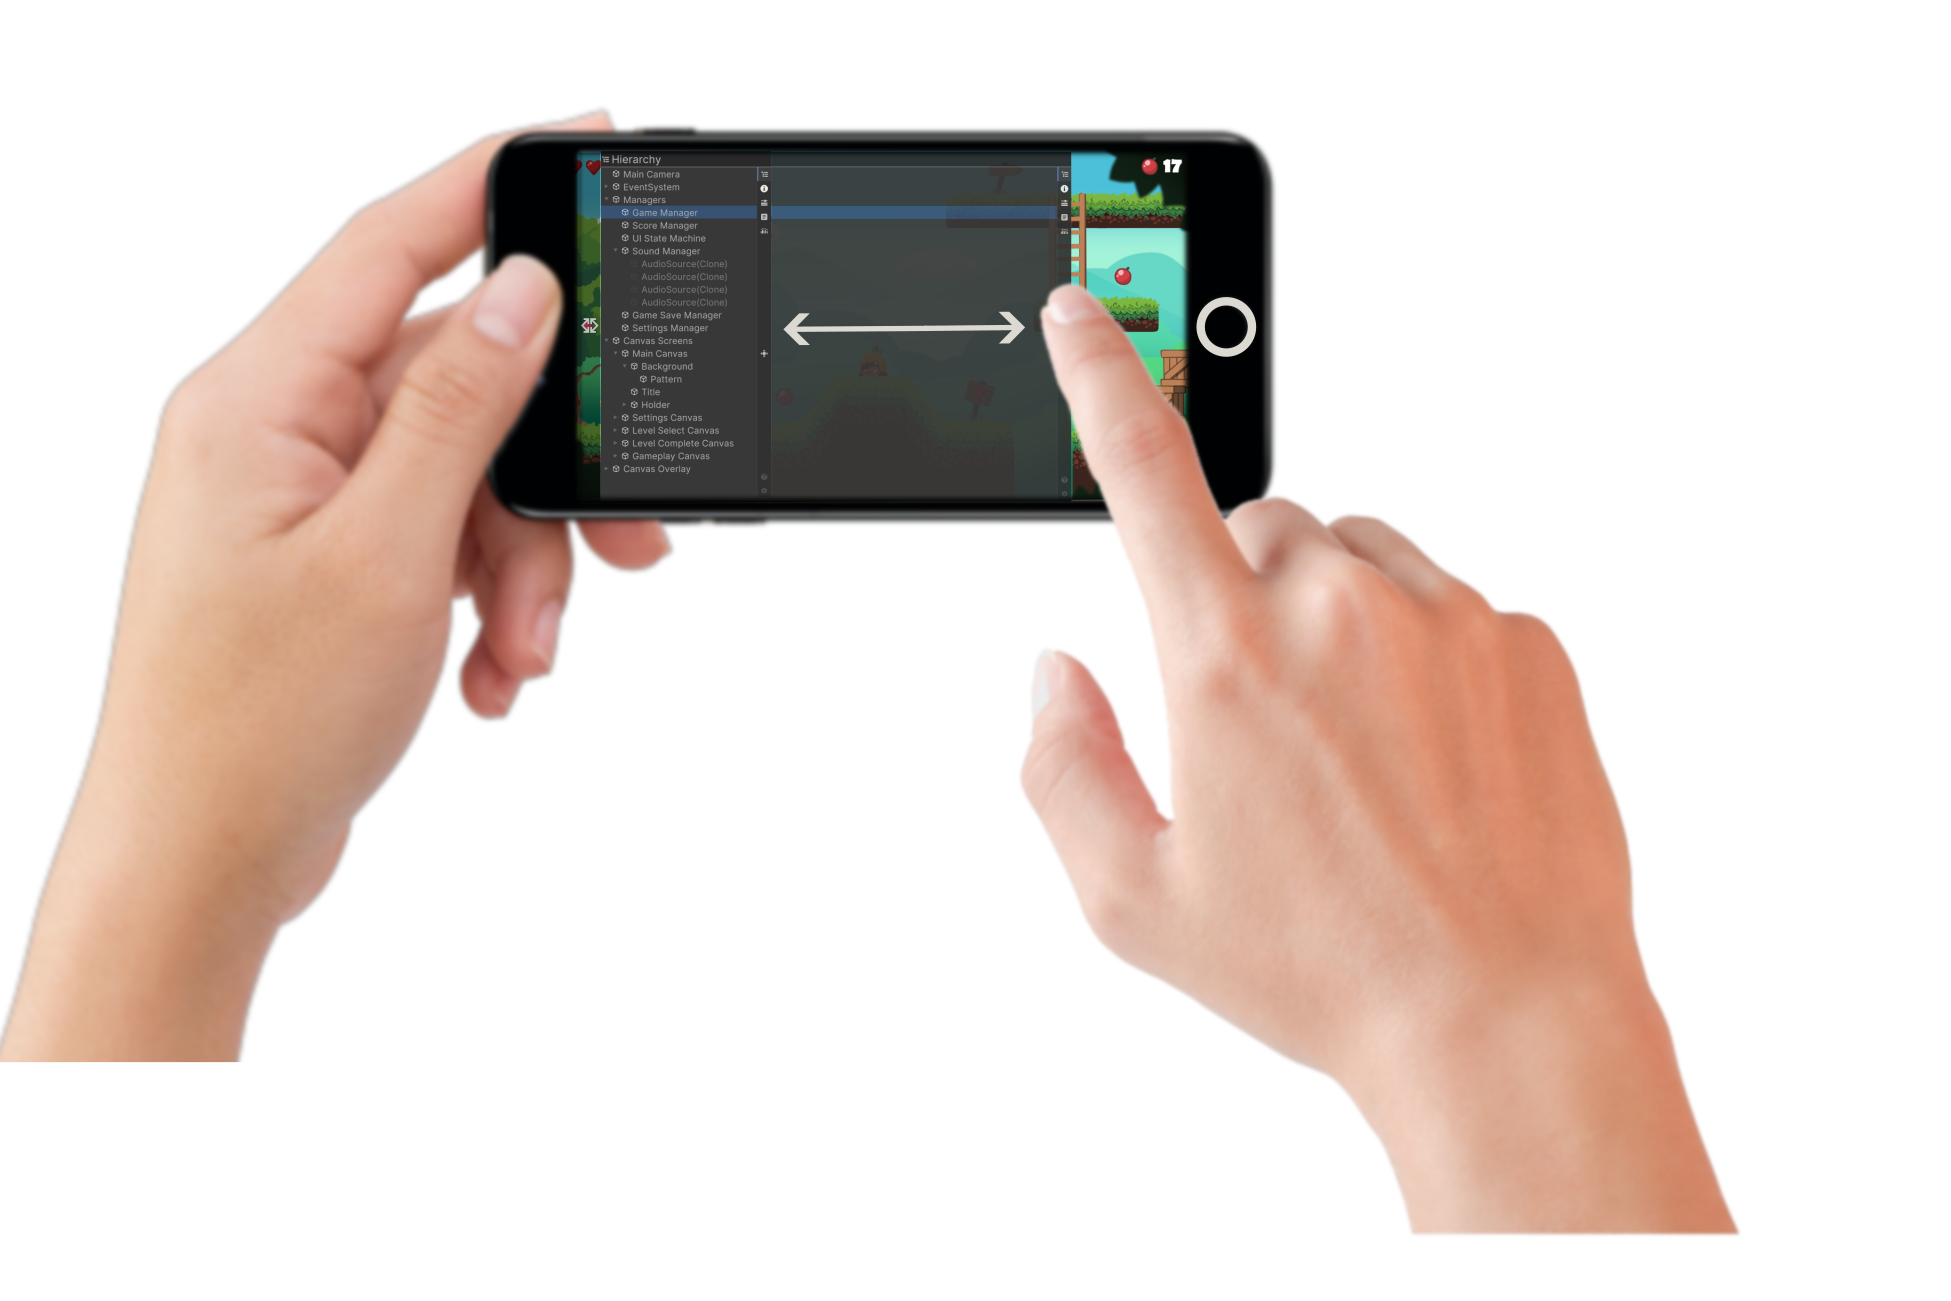
Flexible Layout
DebugKit doesn't force a fixed size on your screen. You can take full control of your workspace by simply dragging and sliding the edge of the panel.- Expand: the view to see deep hierarchy trees or complex inspector data.
- Shrink: the view to keep the toolkit accessible while focusing on your gameplay.
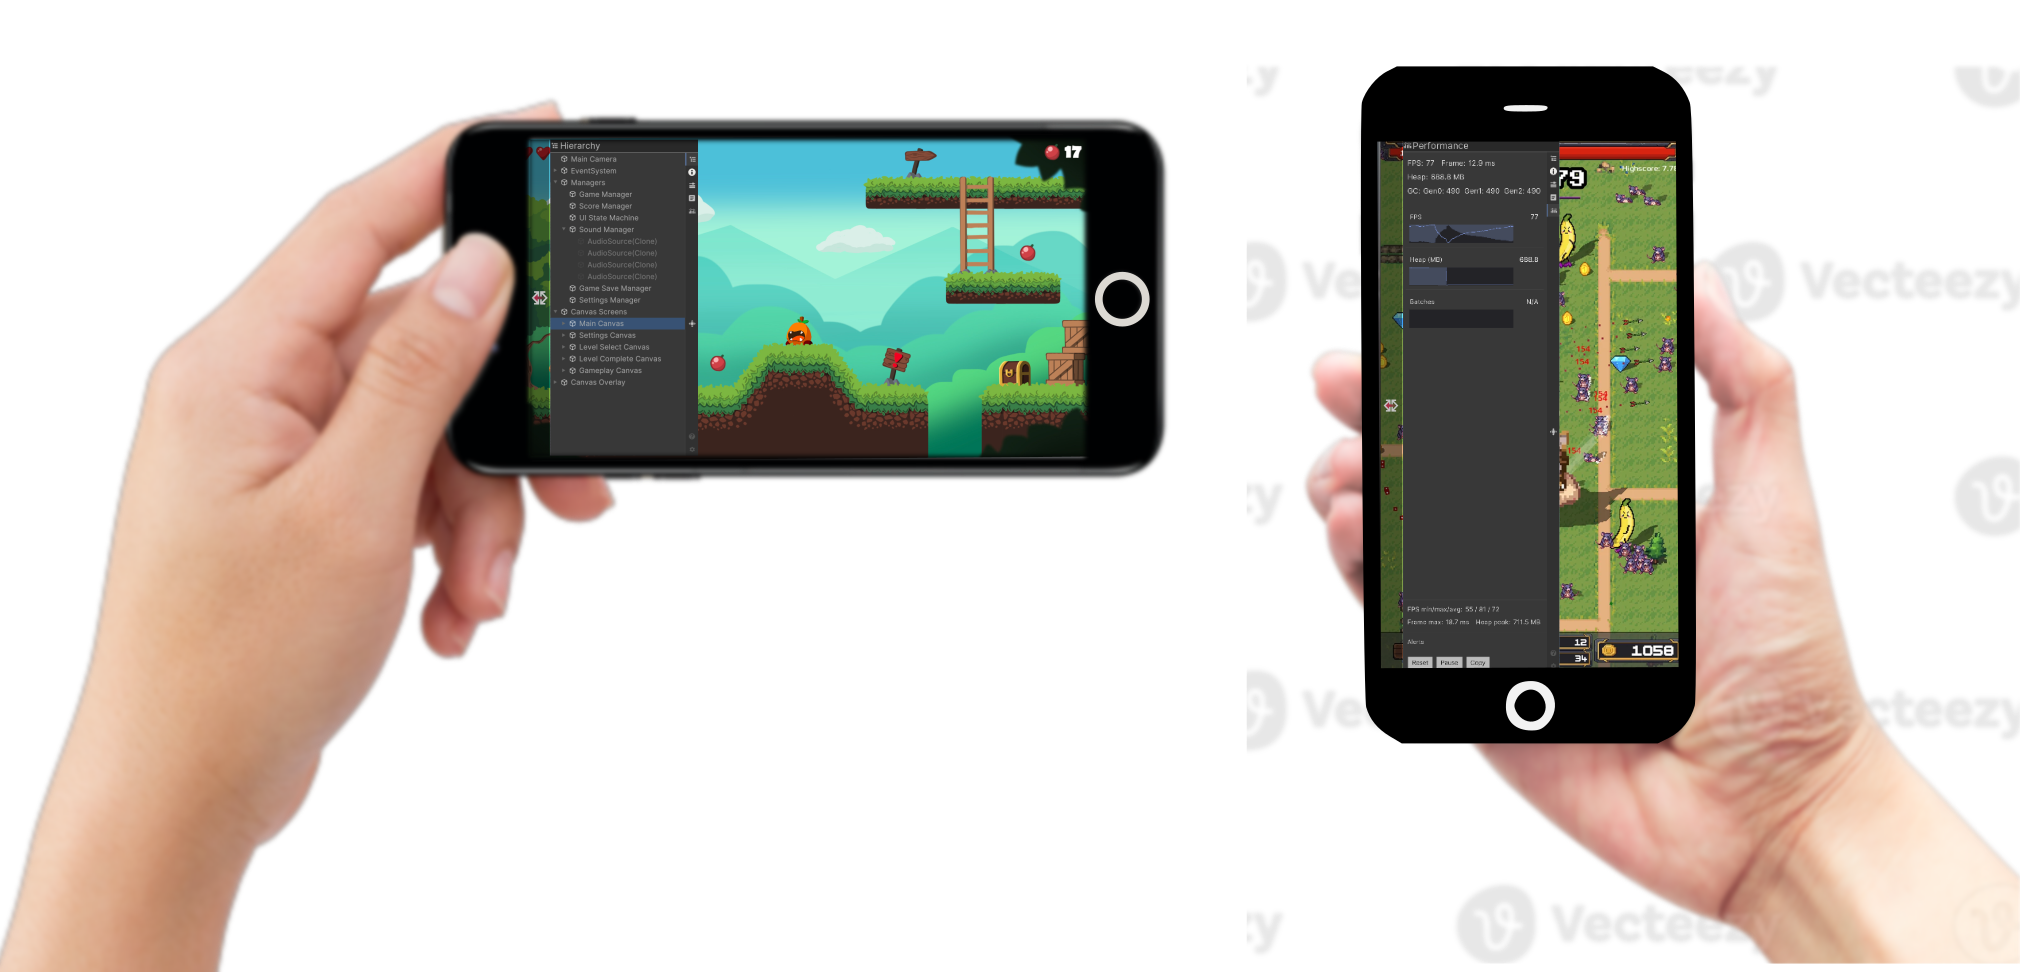
Responsive UI
Built for the modern mobile landscape, the UI is fully responsive out of the box.- Zero Configuration: The tool automatically detects your screen resolution.
- Orientation Support: It reflows instantly between Portrait and Landscape modes, ensuring that buttons, text, and graphs remain perfectly legible regardless of how you hold the device.
Runtime Customization
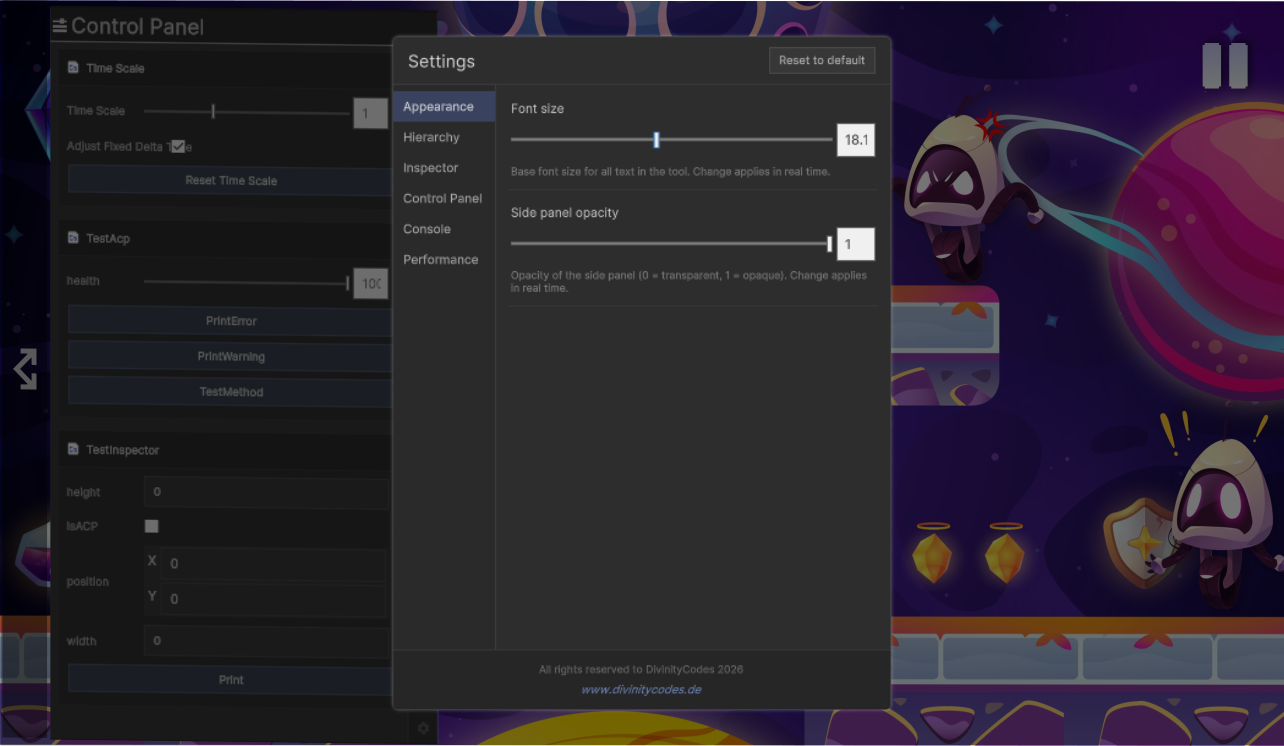
In-Device Preferences
You can fine-tune the toolkit directly on your device to match your specific testing environment. Through the integrated settings menu, you have deep control over the interface and performance. You can adjust a wide array of parameters, including:
-
Font Scaling: Optimize text size for any screen density, from small phones to high-resolution tablets.
-
UI Opacity: Control the transparency of the side panel to maintain visibility of your game world while debugging.
-
Refresh Rates: Balance data precision and hardware performance by choosing how frequently the UI updates.
-
Console & Module Behavior: Fine-tune how logs are captured or toggle specific feature modules to save resources.
-
Persistent Configuration: All changes are saved on the device, ensuring your workspace remains exactly as you configured it across different testing sessions.
Key Benefits
| Benefit | Description |
|---|---|
| Device debugging | Debug on real devices without Unity Editor or build-and-run cycles for simple checks. |
| No scene setup | Auto-bootstrap loads DebugKit from Resources/prefabs/DKManager; no manual placement required. |
| Development-build safety | Optionally show DebugKit only in development builds (Debug.isDebugBuild), keeping it out of release. |
| Persistent across scenes | The auto-spawned instance uses DontDestroyOnLoad, so it survives scene changes. |
| Customizable | Preferences (font size, refresh intervals, console options, etc.) are persisted via PlayerPrefs. |
| Extensible | Expose your own sliders and buttons in the Control Panel via attributes. |
| Lightweight | Feature tabs load on demand; only active feature logic runs (e.g. Performance sampling when the Performance tab is visible). |