Performance
The Performance feature shows real-time metrics (FPS, frame time, managed memory, GC) and optional draw-call batches, with sparkline graphs, summary stats, and configurable alerts.
Overview
- Purpose: Monitor runtime performance on device: FPS, frame time, heap usage, GC collections, and (when available) batch count.
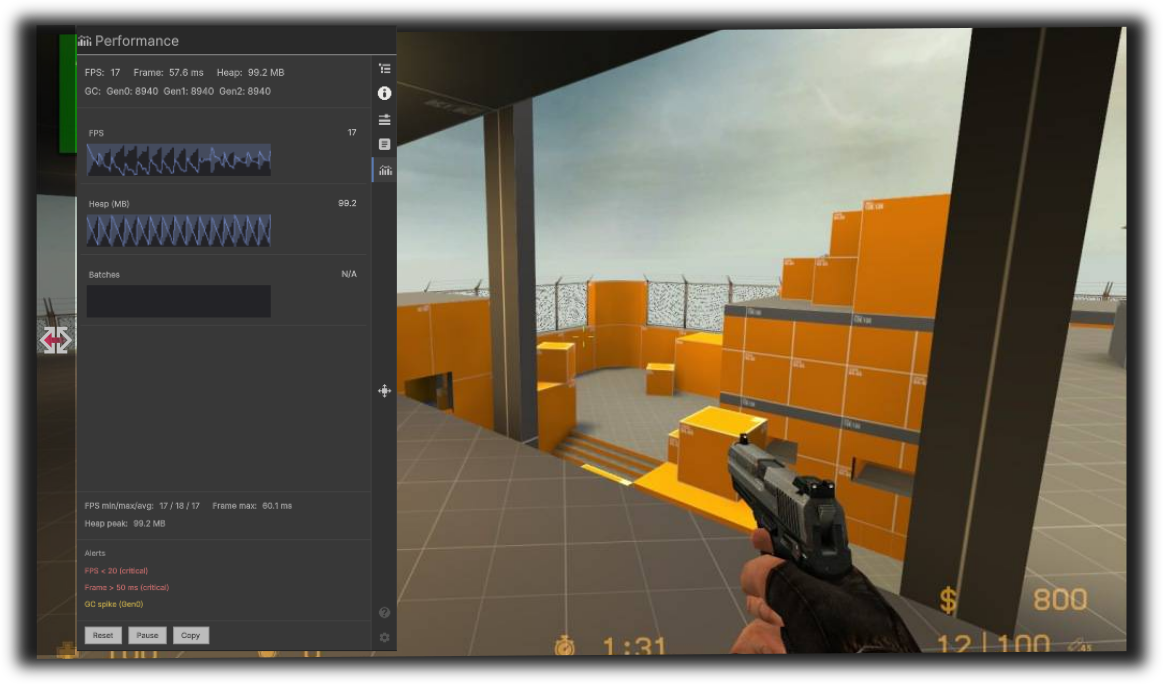
- UI: A stats row (FPS, Frame, Heap, GC), sparkline graphs (FPS, Heap, Batches), min/max/avg summary, an alerts area, and actions (Reset, Pause, Copy).
- Sampling: Metrics are sampled only while the Performance tab is visible, to minimize impact when you are not viewing them.
Benefits
| Benefit | Description |
|---|---|
| Device profiling | See FPS and frame time on real hardware. |
| Memory awareness | Track managed heap and GC (Gen0/1/2) to spot leaks or spikes. |
| Visual trends | Sparklines show recent FPS, heap, and batches over time. |
| Alerts | Automatic warnings for low FPS, high frame time, high heap, or GC spikes. |
| Copy | Copy a text summary of current and summary stats to the clipboard. |
| Pause | Pause sampling to freeze the numbers and graphs for inspection. |
| Reset | Reset min/max/avg and history for a fresh measurement window. |
How to use
- Open DebugKit and switch to the Performance tab.
- Stats row: FPS, Frame (ms), Heap (MB), GC (Gen0/Gen1/Gen2 counts).
- Graphs: FPS, Heap (MB), and Batches (if available) over the last N samples.
- Summary: Min/max/avg FPS, max frame time, peak heap.
- Alerts: Read automatic warnings (e.g. FPS < 30, frame > 33 ms, heap > 1024 MB, GC spike).
- Reset - Clear history and summary for a new measurement period.
- Pause - Pause sampling (button toggles to Resume).
- Copy - Copy a short text summary to the system clipboard.
Metrics
| Metric | Description |
|---|---|
| FPS | Current frames per second (and sparkline history). |
| Frame | Current frame time in milliseconds. |
| Heap | Current managed heap usage in MB. |
| GC | Gen0, Gen1, Gen2 collection counts since start. |
| Batches | Draw call / batch count per frame when available (platform-dependent). |
Alerts
Alerts are shown when:
- FPS below 20 (critical) or below 30 (warn).
- Frame time above 50 ms (critical) or above 33 ms (warn).
- Heap above 1024 MB.
- GC Gen0 spike (increase since last check).
Thresholds are defined in the feature implementation and may be tuned in future versions.
Technical notes
- PerformanceMetricsCollector (or equivalent) gathers FPS, frame time, and memory; PerformanceMonitorBridge connects the collector to the UI and only runs sampling when the Performance tab is active.
- Batches may not be available on all platforms; the Batches graph is hidden or shows N/A when unavailable.
- Sparklines use a fixed sample count (configurable); older samples are dropped.
- Reset clears min/max/avg and sample buffers; Pause stops the sampling timer so values and graphs freeze.